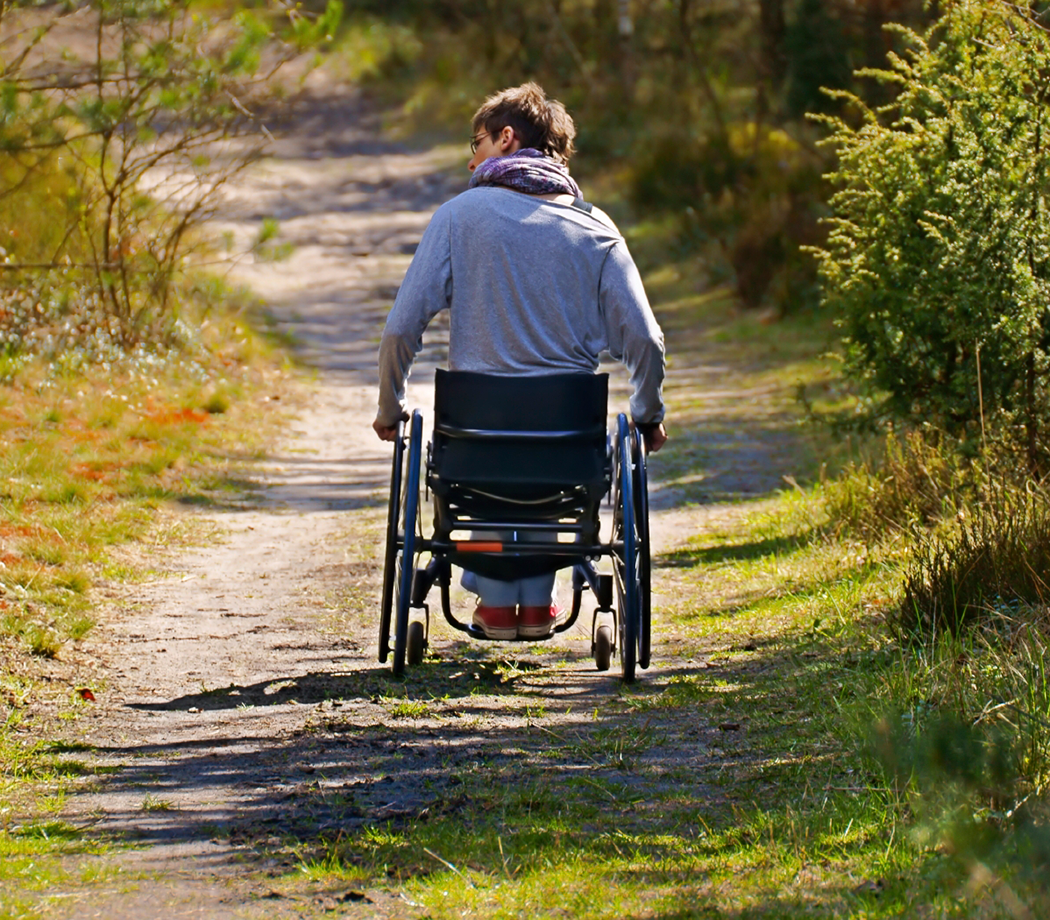
Paralysis in the U.S.
Key Statistics from the National Spinal Cord Injury Statistical Center
- The annual incidence of spinal cord injury (SCI) is approximately 54 cases per one million people in the United States, or about 18,000 new SCI cases each year.
- The estimated number of people with SCI living in the United States is approximately 302,000 persons, with a range from 255,000 to 383,000 persons.
- The average age at injury has increased from 29 years during the 1970s to 43 since 2015.
- About 79% of new SCI cases are male.
- SCIs occur disproportionally in African Americans, who represent about 25% of injuries.
- Vehicle crashes are the most recent leading cause of injury, closely followed by falls. Acts of violence (primarily gunshot wounds) and sports/recreation activities are also common causes.
Download NSCISC PDF for more information.
Reeve Foundation Data: Prevalence, Quality of Life, Caregiving & More
In 2013, the Christopher & Dana Reeve Foundation unveiled staggering statistics based on research into the prevalence of paralysis across the U.S. According to the Foundation’s research, there are nearly 1 in 50 people living with paralysis – approximately 5.4 million people. That’s the same number of people as the combined populations of Los Angeles, Philadelphia, and Washington D.C. And that number is nearly 40 percent higher than previous estimates showed.
Researchers designed and conducted an exhaustive survey of more than 70,000 household across the country. More than 30 experts in paralysis and statistics, including those from the Centers for Disease Control and Prevention (CDC) and 14 leading universities and medical centers helped to develop and set the parameters for the study — one of the largest population-based samples of any disability ever conducted.
The study revealed significant findings about the prevalence of paralysis and quality of life for those living with paralysis:
- Paralysis is dramatically more widespread than previously thought. Approximately 1.7 percent of the U.S. population, or 5,357,970 people reported they were living with some form of paralysis, defined by the study as a central nervous system disorder resulting in difficulty or inability to move the upper or lower extremities.
- The leading cause of paralysis was stroke (33.7 percent), followed by spinal cord injury (27.3 percent) and multiple sclerosis (18.6 percent).
- People living with paralysis have households with lower incomes. Roughly 28% of households with a person who is paralyzed make less than $15,000 per year.
- On the employment front, 15.5% of individuals living with paralysis are employed versus 63.1% who are not living with a disability. Additionally, 41.8% of those living with paralysis indicated they were unable to work.
*The overall pie chart represents the causes of paralysis for 1,079,866 valid responses. Of the 1.4 million persons who reported a spinal cord injury, the cause of paralysis could not be determined for 26% (n=382,334) due to missing, unintelligible, or incomplete data.
Download Paralysis in the U.S. Policy Brief.
Download Prevalence and Causes of Paralysis — United States, 2013 from American Journal of Publish Health.
Released in fall 2022, the Reeve Foundation survey, “Living with Paralysis & Caregiver National Survey,” a survey of more than 1,000 Americans, found that a majority (69%) underestimate the prevalence of those living with paralysis in the U.S. – about two out of every 100 individuals. However, one in three Americans say that they know someone who is paralyzed, and most (79%) also believe that a family member providing long-term care for someone living with paralysis should receive compensation from the government.
The Living with Paralysis & Caregiver National Survey serves to educate and inform families, business leaders, advocates, policymakers, and the general public about improving quality of life for those living with, or impacted by, paralysis.
Other key findings included:
- With regards to compensation, women are more likely to be concerned about the need for money/income support from the government versus men; and Gen Z is twice as likely than other generations (33% versus about 15%) to believe that the government can/should financially help.
- One in four Americans say that they know a caregiver of someone living with paralysis.
- Two-thirds of survey respondents who serve as caregivers to a family member living with a disability and who regularly assist with daily living activities (a group comprising 18% of all respondents) are unpaid.
Additional findings included:
Americans with Disabilities Act (ADA)
- The survey found that nearly all Americans say that they are familiar with the ADA (96%). Of those, most (74%) believe there is a need for additional support from the U.S. government for wheelchair users beyond the ADA.
Income
- Many Americans (65%) believe that some form of insurance (Medicare/Medicaid), or health/disability insurance would be their main source of funds to cover the cost of day-to-day living if they were to become paralyzed. This suggests that many are not aware of the financial realities of paralysis, including limitations of public and private insurers and disability benefits, as well as high lifetime costs of the condition.
Travel
- When it comes to air travel, 34% of adults believe the greatest challenge for someone living with paralysis is the inability to use airplane restrooms. Further, most Americans (96%) do not recognize traveling on airplanes as one of the more difficult challenges in life for those living with paralysis, despite increased media attention of frequent, costly damages to wheelchairs, dehumanizing experiences and even death.


